Modeling RTD Resistance-temperature Characteristics
Model the characteristic curve of a resistance temperature detector (RTD) and the common standards used to characterize these devices like the alpha parameter and Callendar-Van Dusen equation.
RTDs are a common type of temperature sensor with high accuracy, excellent long-term stability, and repeatability. In addition, these types are sensors are fairly linear devices. Over a narrow temperature range, a linear model can be used to describe the resistance-temperature curve of an RTD. For higher accuracies, however, a fourth-order polynomial, called the Callendar-Van Dusen equation, is normally used to describe the sensor response.
This article discusses modeling the characteristic curve of RTDs and the common standards used to characterize these devices.
RTD Linearity vs Thermocouple Linearity
The blue curve in Figure 1 shows the resistance-temperature characteristic of a 100 Ω platinum RTD built to the DIN/IEC 60751 standard. The standard requires the sensor to exhibit 100 Ω and 138.5 Ω at 0 °C and 100 °C, respectively.
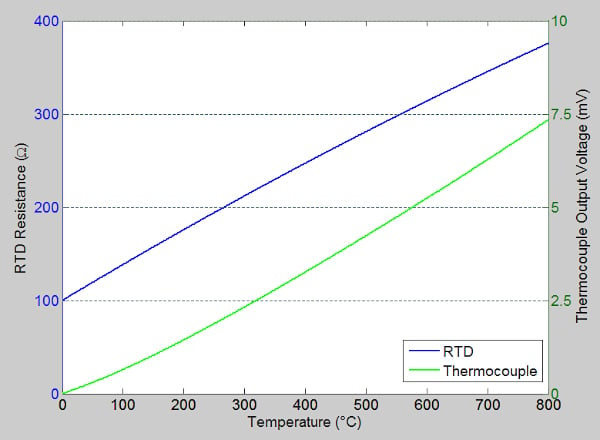
Figure 1. RTD resistance-temperature characteristic chart.
On the other hand, the green curve in Figure 1 shows the output voltage of a type S thermocouple. Visual inspection suggests that an RTD is more linear than a thermocouple (you can more easily recognize deviations of a type S thermocouple from a straight line over the temperature range from 100 °C to 300 °C). The nonlinear behavior of these two sensor types is best shown by plotting the slope of the above curves. The slope curves, plotted in Figure 2, show how the sensitivity of these sensors changes with temperature.
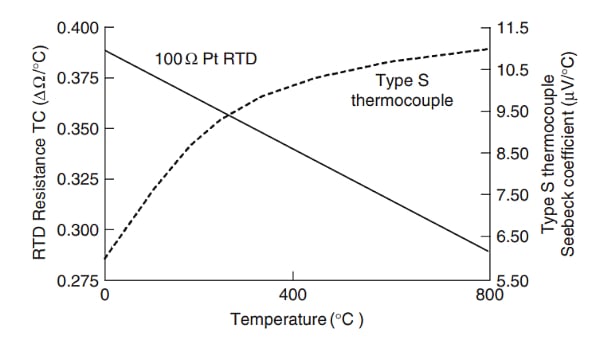
Figure 2. Slope curves showing sensor changes with temperature. Image used courtesy of Analog Devices
To have a linear response, we expect the sensitivity curves to have minimal variation over the temperature range of interest. Neither RTDs nor thermocouples are perfectly linear; however, RTDs tend to offer a more linear response. In the above example, the sensitivity of the RTD changes by about 25% from 0 °C to 800 °C, whereas the Seebeck coefficient of the thermocouple changes by about 83%.
RTD Temperature Coefficient or "Alpha Parameter"
Since an RTD is a fairly linear device, a single value known as the “alpha” parameter or the temperature coefficient of the RTD can be used to specify its resistance-temperature characteristic. The alpha parameter (α) is defined as the average change in resistance per unit of temperature over the temperature range from 0 ºC to 100 ºC, divided by the nominal resistance value at 0 ºC. Translated mathematically, this parameter can be found by applying the following equation:
\[a=\frac{R_{100}-R_{0}}{100\times R_{0}}\]
Where R100 and R0 denote the sensor resistance at 100 ºC and 0 ºC, respectively. The unit of α is Ω/Ω/°C, while the temperature coefficient for pure metals is in the 0.003 to 0.007 Ω/Ω/°C range. Keep in mind that a small number of impurities can significantly change the temperature coefficient of a metal.
Characterizing RTDs Through Temperature Coefficients
Different organizations have adopted different temperature coefficients as their standard to have a consistent way of characterizing RTDs. In 1983, the IEC (International Electrotechnical Commission) adopted the DIN (Deutsche Institute for Normung) standard for 100 Ω platinum RTDs. This standard, known as DIN/IEC 60751, or simply IEC-751, defines the temperature versus resistance for 100 Ω, 0.00385 Ω/Ω/°C platinum RTDs. A 100 Ω platinum RTD built to IEC-751 must have an electrical resistance of 100.00 Ω at 0 °C and an average temperature coefficient of resistance (TCR) of 0.003850 Ω/Ω/°C between 0 and 100 °C.
Another commonly mentioned temperature coefficient value for platinum RTDs is 0.003923 Ω/Ω/°C, which corresponds to the SAMA (Scientific Apparatus Makers Association) standard. Table 1 below lists the parameters of some other RTD standards. We’ll discuss shortly what the A, B, and C values in this table mean.
Table 1. Three examples of RTD temperature coefficient standards. Data used courtesy of TI
| Standard | Temperature Coefficient (a) | A | B | C* |
| DIN 43760 | 0.003850 Ω/Ω/°C | 3.908 × 10⁻³ | -5.8019 × 10⁻⁷ | -4.2735 × 10⁻¹² |
| American | 0.003911 Ω/Ω/°C | 3.9692 × 10⁻³ | -5.8495 × 10⁻⁷ | -4.2325 × 10⁻¹² |
| ITS-90 | 0.003926 Ω/Ω/°C | 3.9848 × 10⁻³ | -5.870 × 10⁻⁷ | -4.000 × 10⁻¹² |
Currently, the DIN/IEC-751 is the accepted industry standard in most countries; however, you still need to consult the RTD datasheet to make sure to which standard the device is built. If you use an RTD that is inconsistent with your measurement system, you could have a significant error in your measurements.
Using the Alpha Parameter
Specifying the slope of the characteristic curve, the alpha parameter allows us to estimate the RTD resistance through the following equation:
\[R(T)=R_{0}(1+\alpha T)\]
Equation 1.
Where R(T) and R0 are the resistance value at temperatures T and 0 ºC, respectively.
As an example, assume that R0 = 100 Ω and α = 0.003850 Ω/Ω/°C. By applying the above equation, the resistance at 150 °C can be estimated as R = 157.75 Ω. Equation 1 is only a linear model of the actual response of the sensor. The error from this linear model is less than about 3.1 ºC over the -100 to 200 ºC temperature range. We can use this linear model for a limited temperature range of around 0 ºC. However, over the whole temperature range of the RTD, deviation from the linear model is significant, as shown below in Figure 3.
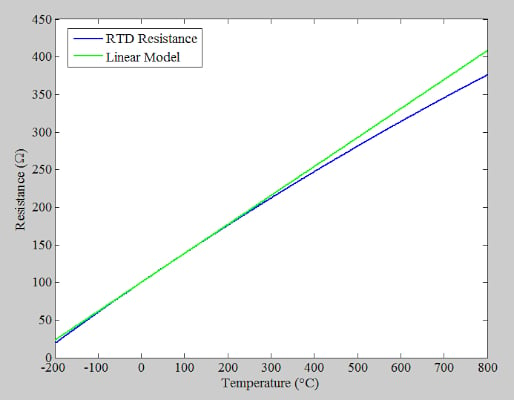
Figure 3. Resistance vs temperature linear model and RTD resistance.
If higher accuracy is required, we can use the well-known Callendar-Van Dusen equation, which we’ll dive into in the next section.
Callendar-Van Dusen Equation
The Callendar-Van Dusen equation is a fourth-order polynomial that defines the resistance-temperature characteristic of an RTD. The equation, which is named after the two scientists who worked on RTDs about 100 years ago, yields the RTD resistance as:
\[R(T)=R_{0}(1+AT+B(T)^{2}+C(T)^{3}(T-100))\]
Equation 2.
Where:
- R0 is the resistance at 0 ºC
- T is the temperature in celsius
- A, B, and C are constants that depend on the specific RTD used
Table 1 gives these coefficients for three different standards. Note that the C coefficient takes the non-zero value given in the table only when dealing with negative temperatures. For positive temperatures, C = 0 should be used, which simplifies the equation.
For a DIN/IEC-751 platinum RTD with α = 0.003850 Ω/Ω/°C, the coefficients are:
\[A=3.9083\times 10^{-3}in(°C)^{-1}\]
\[B=-5.775\times 10^{-7}in(°C)^{-2}\]
\[C=-4.183\times 10^{-12}in(°C)^{-4}\]
As an example, consider a 100 Ω platinum RTD with a temperature coefficient of 0.003850 Ω/Ω/°C built to the IEC-751 standard. Substituting the above values in Equation 2 yields a resistance value of 157.325 Ω at = 150 °C. Note that C = 0 for this calculation.
Equation 2 gives the RTD resistance in terms of its temperature. In many practical RTD applications, however, we need to solve Equation 2 to determine the temperature from knowledge of RTD resistance. This can be more complicated and processor-intensive, given the nonlinear transfer function of the RTD. It is possible to find the inverse of the Callendar-Van Dusen equation.
This calculation is fairly straightforward for positive temperature, which involves a quadratic equation. For negative temperatures, it is required to find the inverse of the fourth-order equation. In this case, computer programs, such as Mathematica, can be used to find a close approximation to the inverse transfer function. An alternative method is the piecewise linear approximation method. To learn more about these methods, you can refer to this application note from Analog Devices.
RTD Response and Higher Order Models
Although the Callendar-Van Dusen equation is reasonably accurate, a higher-order polynomial can better describe the actual RTD response. Callendar and Van Dusen had to use a relatively simple equation because they developed their model years before the arrival of modern digital computers. In 1968 the IEC developed a 20-term polynomial for 100 Ω platinum RTDs. Although this newer model produces much more accurate results, the Callendar-Van Dusen equation is still a commonly used model because it provides reasonable accuracy without consuming significant processing power.
IEC-751 Standard Tolerances and RTD Temperature Ranges
In addition to defining the resistance-temperature characteristic, IEC-751 also specifies standardized tolerances and operating temperature ranges for RTDs. Table 2 lists the five main classes of RTDs and gives the temperature range, temperature tolerance, resistance tolerance at °C, and the resulting error at 100 °C for each class.
Table 2. Breakdown of different RTD specifications regarding temperature, tolerance, and resistance. Data used courtesy of TI
| Tolerance Class (DIN-IEC 60751) | Temperature Range of Validity | Tolerance Values (C) | Resistance at 0C (Ohms) | Error at 100C (C) | Error over Wire-Wound Range (C) | |
| Wire-Wound | Thin-Film | |||||
| AAA (1/10 DIN) | 0 - +100 | 0 - +100 | +/-(0.03 + 0.0005*t) | 100 +/- 0.012 | 0.08 | 0.08 |
| AA (1/3 DIN) | -50 - +250 | 0 - +150 | +/-(0.01 + 0.0017*t) | 100 +/- 0.04 | 0.27 | 0.525 |
| A | -100 - +450 | -30 - +300 | +/-(0.15 + 0.002*t) | 100 +/- 0.06 | 0.35 | 1.05 |
| B | -196 - +600 | -50 - +500 | +/-(0.3 + 0.005*t) | 100 +/- 0.12 | 0.8 | 3.3 |
| C | -196 - +600 | -50 - +600 | +/-(0.6 + 0.01*t) | 100 +/- 0.24 | 1.6 | 6.6 |
For example, a Class A RTD can have an error as large as ±(0.15+0.002*100) = ±0.35 °C at 100 °C. Figure 4 helps you visualize the upper and lower error limits for Class A and B RTDs.
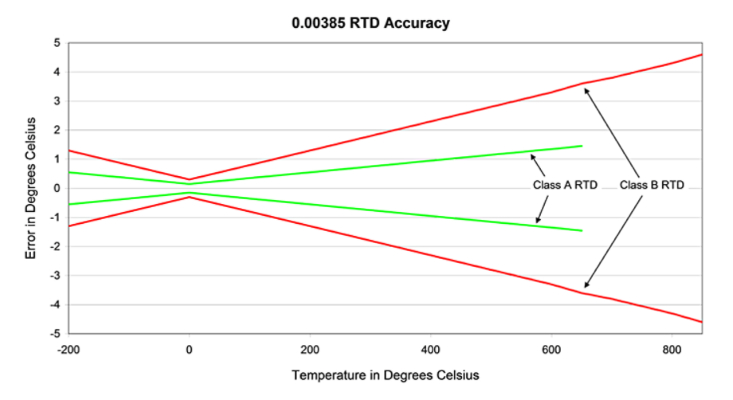
Figure 4. A chart showing the RTD's accuracy through error limits and temperature. Image used courtesy of BAPI
Note that the AAA (1/10DIN) class is not included in the DIN-IEC-60751 spec but is an industry-accepted tolerance class for high-performance measurements. With RTDs built to these widely accepted standards, it is easier to replace a sensor with one from the same or a different manufacturer while ensuring that the desired performance will be retained with minimal redesign or recalibration of the system. This interchangeability can reduce the time to market for your product.
To see a complete list of my articles, please visit this page.